metric 수집 방식
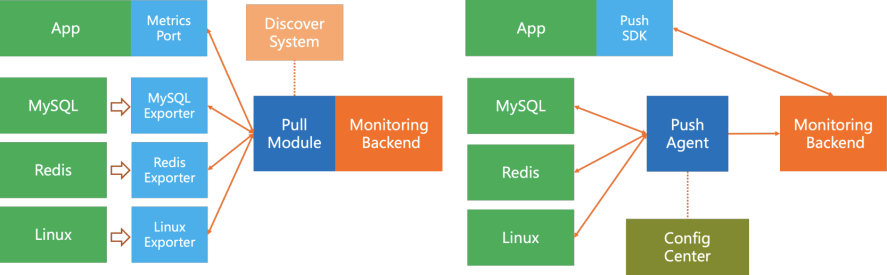
- push: monitoring 자원에서 서버로 지표들을 전송한다. 서버로 지표를 전송하기 위해 각 monitoring 자원에 agent 설치가 필요하다. 각 monitoring 자원들이 서버로 지표를 전송하기 때문에 보안성 측면에서 안전하다.
ex) Nagios, Zabbix - pull: 서버에서 monitoring 자원들에게 지표 전송을 요청하여 받는다. 서버에서 monitoring 자원들을 관리할 수 있기 때문에 monitoring 지표들의 설정을 일괄적으로 변경하거나 monitoring 자원들의 health check를 확인하는 것이 편리하지만, cloud에서 scale in/out 되는 자원들에게 지표 전송을 요청하기 위해 service discovery라는 기능이 필요하다.
ex) Prometheus, Datadog, collectd
Cloudwatch
- AWS 자원들의 log, metric, event data를 분석하기 쉽도록 시각화하는 서비스
- AWS에서 monitoring 대상들의 기본 지표들을 제공하고 있지만 agent를 대상에 설치할 경우 좀 더 정밀한 지표 설정이 가능하다. (monitoring 자원이 Cloudwatch에 접근하기 위해 CloudWatchAgentServerPolicy과 같은 policy를 가진 IAM role을 가지고 있어야 한다.)
- ubuntu에 cloudwatch agent 설치하기 (ubuntu 20.04 기준)
- agent download 후 설치
https://docs.aws.amazon.com/ko_kr/AmazonCloudWatch/latest/monitoring/install-CloudWatch-Agent-commandline-fleet.html
sudo dpkg -i -E ./amazon-cloudwatch-agent.deb - install wizard로 agent config file 생성 (agent 설정)
sudo /opt/aws/amazon-cloudwatch-agent/bin/amazon-cloudwatch-agent-config-wizard
/opt/aws/amazon-cloudwatch-agent/bin 경로에 agent install wizard, amazon-cloudwatch-ctl 등을 찾아볼 수 있음 - 서비스 시작
sudo /opt/aws/amazon-cloudwatch-agent/bin/amazon-cloudwatch-agent-ctl -a fetch-config -m ec2 -s -c file:/opt/aws/amazon-cloudwatch-agent/bin/config.json
sudo /opt/aws/amazon-cloudwatch-agent-ctl -m ec2 -a start - 서비스 상태 확인
sudo /opt/aws/amazon-cloudwatch-agent/bin/amazon-cloudwatch-agent-ctl -m ec2 -a status
more /opt/aws/amazon-cloudwatch-agent/logs/amazon-cloudwatch-agent.log
- agent download 후 설치
- ALB access log 속성을 변경하여 access log를 s3에 저장하고 athena를 통해 query 가능
https://docs.aws.amazon.com/ko_kr/athena/latest/ug/application-load-balancer-logs.html
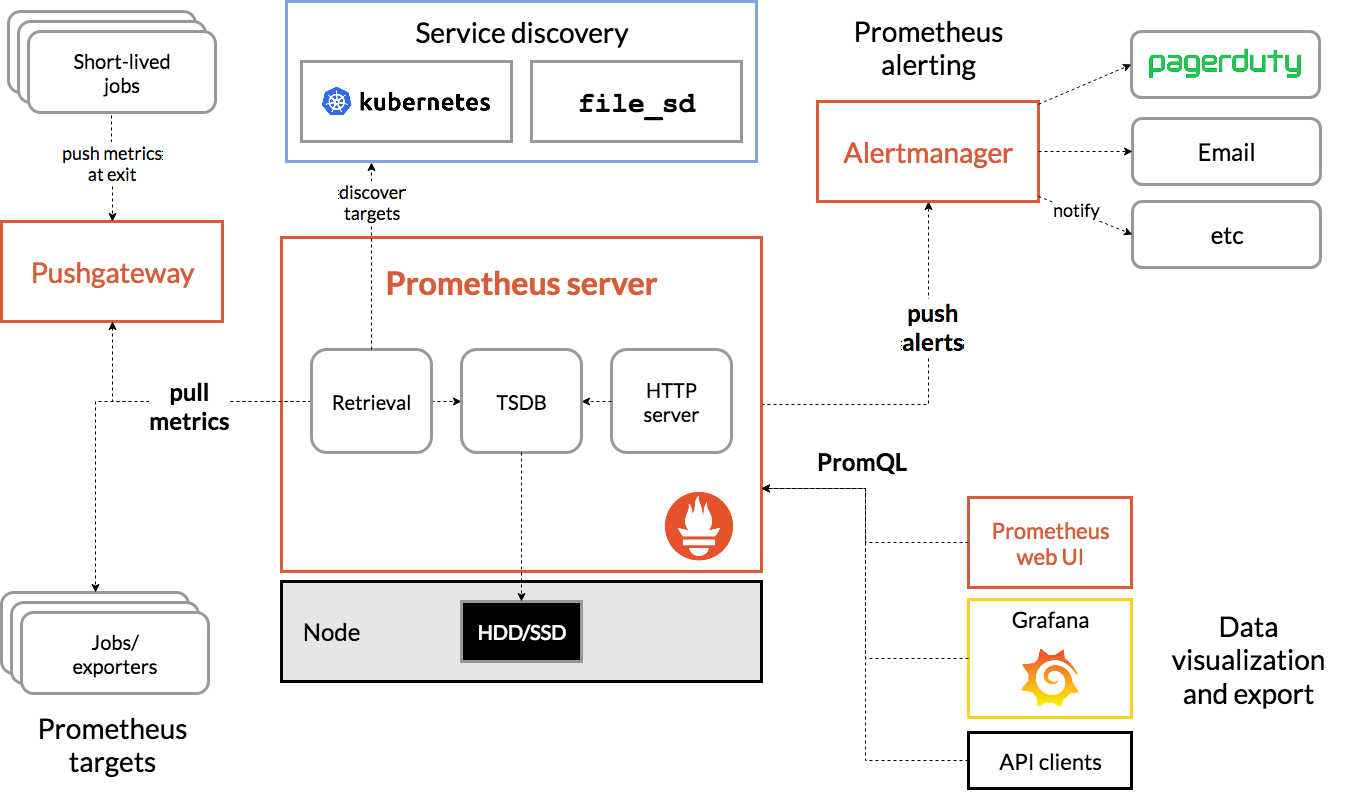
Prometheus
- monitoring용 open source system
- metric 이름과, key/value 쌍으로 구별되는 시계열로 이루어진 다차원 data model
- pull 방식을 기본으로 채택하고 있으며, push 방식을 위해서는 gateway가 별도로 필요함
- service discovery를 통해 scale in/out 된 서버들에 대해서도 metric을 자동으로 수집
- metric에 대한 query를 지원하기 위해 PromQL을 사용함
architecture
![Desktop View]()
- prometheus.yml
1
2
3
4
5
6
7
8
9
10
11
12
13
14
15
16
17
18
19
global:
  scrape_interval:     15s # By default, scrape targets every 15 seconds.

  # Attach these labels to any time series or alerts when communicating with
  # external systems (federation, remote storage, Alertmanager).
  external_labels:
    monitor: 'codelab-monitor'

# A scrape configuration containing exactly one endpoint to scrape:
# Here it's Prometheus itself.
scrape_configs:
  # The job name is added as a label `job=<job_name>` to any timeseries scraped from this config.
  - job_name: 'prometheus'

    # Override the global default and scrape targets from this job every 5 seconds.
    scrape_interval: 5s

    static_configs:
      - targets: ['localhost:9090']
Exporter
- 지표들을 수집하기 위해 target에 설치하는 agent
- exporter는 http endpoint로 수집한 metric을 노출시키고 prometheus는 http rest api를 통해 metric을 수집함
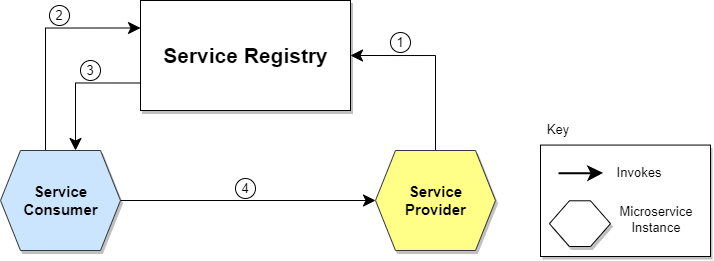
Service Discovery
- network 내에서 data를 수집당하는 client를 자동으로 검색하는 기술
- cloud 환경에서 auto scaling이 되는 target들을 자동으로 추가하거나 삭제함
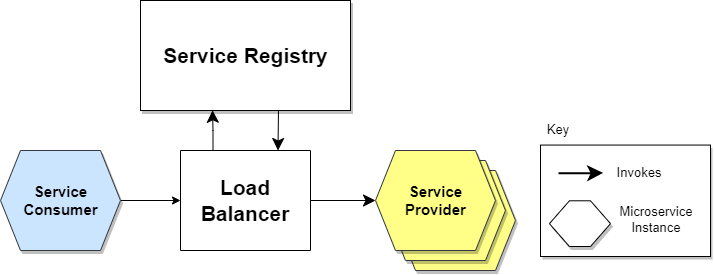
- service discovery 실행 과정
- provider의 위치 정보를 registry에 등록
- consumer가 registry에 provider의 위치를 요청
- consumer는 받은 provider의 위치 정보를 토대로 직접 provider에게 요청
- 여기서 provider가 data를 수집당하는 client, consumer가 data를 모으는 server
![Desktop View]()
- 여기서 provider가 data를 수집당하는 client, consumer가 data를 모으는 server
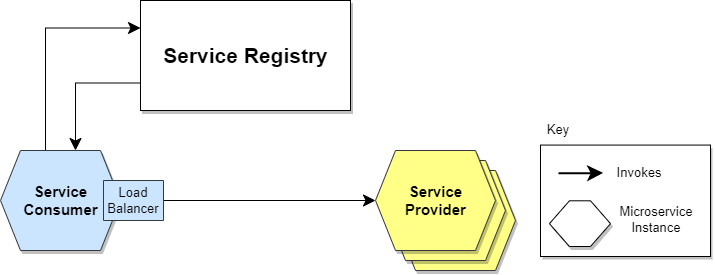
client -> service discovery
![Desktop View]()
- server -> service discovery
![Desktop View]()
참고